Exploring Data
While kamu focuses primarily on the problem of data management, you often may want to do some basic data exploration before exporting data for further use in your data science projects, so we decided to provide a few simple exploration tools for you to assess the state of data without leaving the comfort of one tool.
Tail Command
Use kamu tail command to quickly view a sample of last events in a dataset:
kamu tail ca.bccdc.covid19.case-details
Inspect Command Group
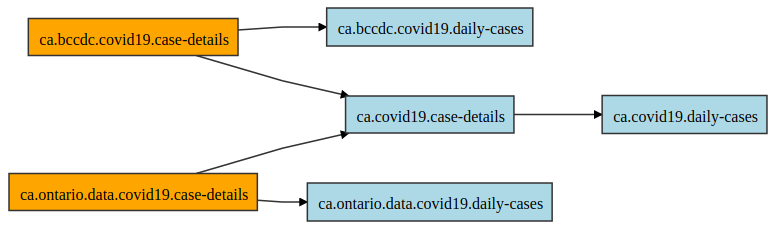
A set of kamu inspect * commands allows you to explore metadata and lineage of datasets. For example to display the lineage of a certain dataset in a browser use:
kamu inspect lineage ca.covid19.daily-cases -b
SQL Console
kamu sql command group provides a simple way to run ad-hoc queries and explore data using SQL language.
Following command will drop you into the SQL shell:
kamu sql
By default this command uses the Apache Datafusion engine, so its powerful SQL is now available to you.
All datasets in your workspace should be available to you as tables:
show tables;
You can use describe to inspect the dataset’s schema:
describe "us.cityofnewyork.data.zipcode-boundaries";
And of course you can run queries against any dataset:
select
  *
from "us.cityofnewyork.data.zipcode-boundaries"
order by pop_est desc
limit 5;
Use Ctrl+D to exit the SQL shell.
SQL is a widely supported language, so kamu can be used in conjunction with many other tools that support it, such as Tableau and Power BI. See integrations for details.
The kamu sql is a very powerful command that you can use both interactively or for scripting. We encourage you to explore more of its options through kamu sql --help.
Jupyter Notebooks
Kamu also connects the power of Apache Spark with the Jupyter Notebook server. You can get started by running:
kamu notebook
-e ENV_VAR option to pass additional environment variable into the notebook server. This can be very useful for different access and security tokens needed by different visualization APIs.Executing this should open your default browser with a Jupyter running in it.
From here let’s create a new notebook. We start our notebook by loading kamu extension:
%load_ext kamu
And creating kamu connection:
import kamu
con = kamu.connect()
The library will automatically connect to your local workspace node, but you can also provide a URL to mix local and remote connections (see the library documentation for details).
You can now query the datasets using the connection:
con.query("select * from 'my-dataset' limit 3")
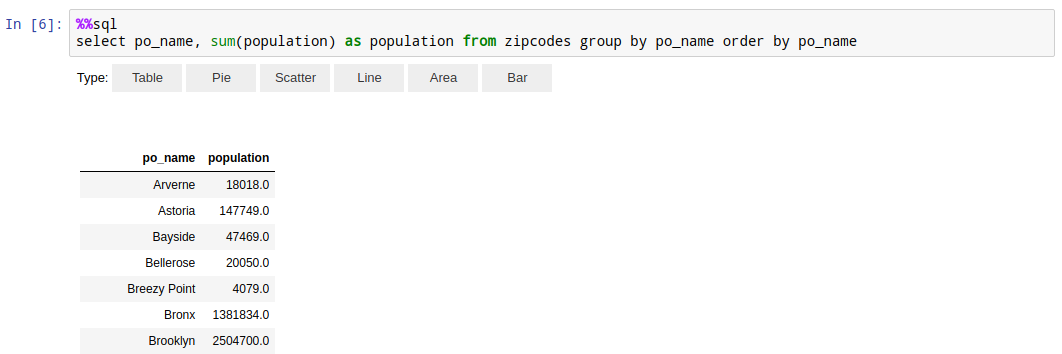
Or, more conveniently, using the %%sql cell magic:
%%sql
select * from 'my-dataset' limit 3
By default the notebook command will use DataFusion engine. To start with Spark use:
kamu notebook --engine spark
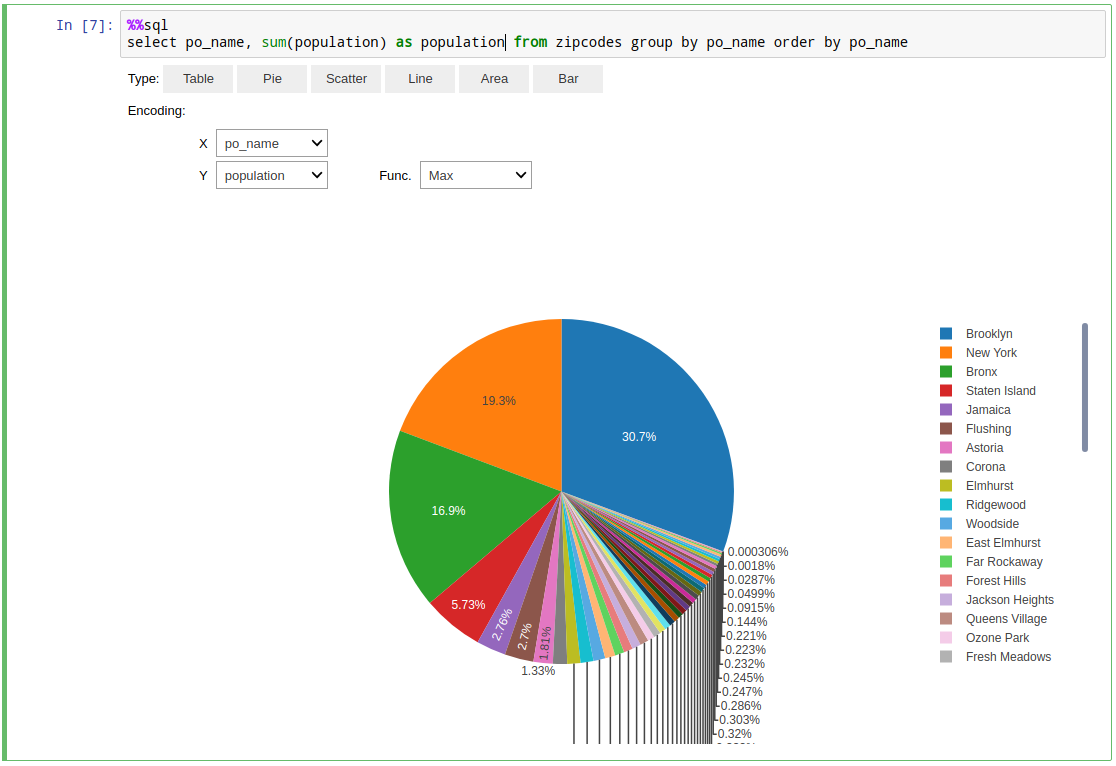
The queries return regular Pandas dataframe.
Thanks to the autovizwidget library you also get some simple instant visualizations for results of your queries.
To assign the result of %%sql cell to a variable use:
%%sql -o my_dataframe
select * from x
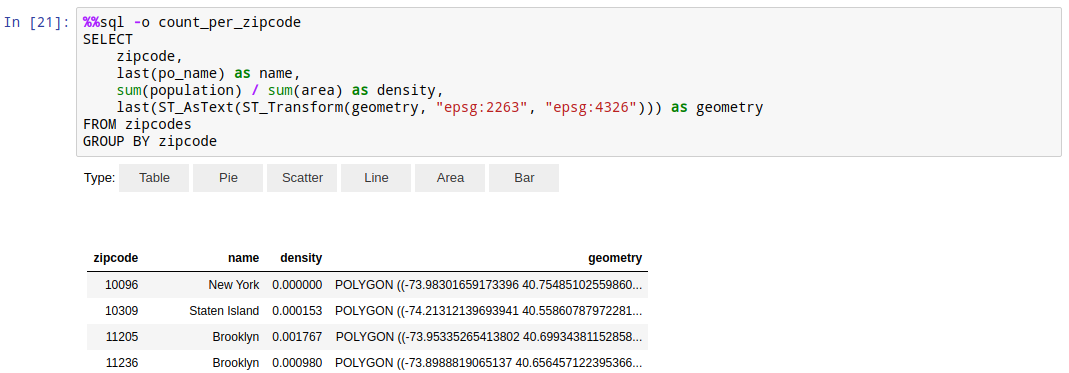
You can use any of your favorite libraries to further process and visualize it.
Web UI
And finally, kamu comes with embedded Web UI that you can use to explore your pipelines and run SQL queries on data from the comfort of your browser:
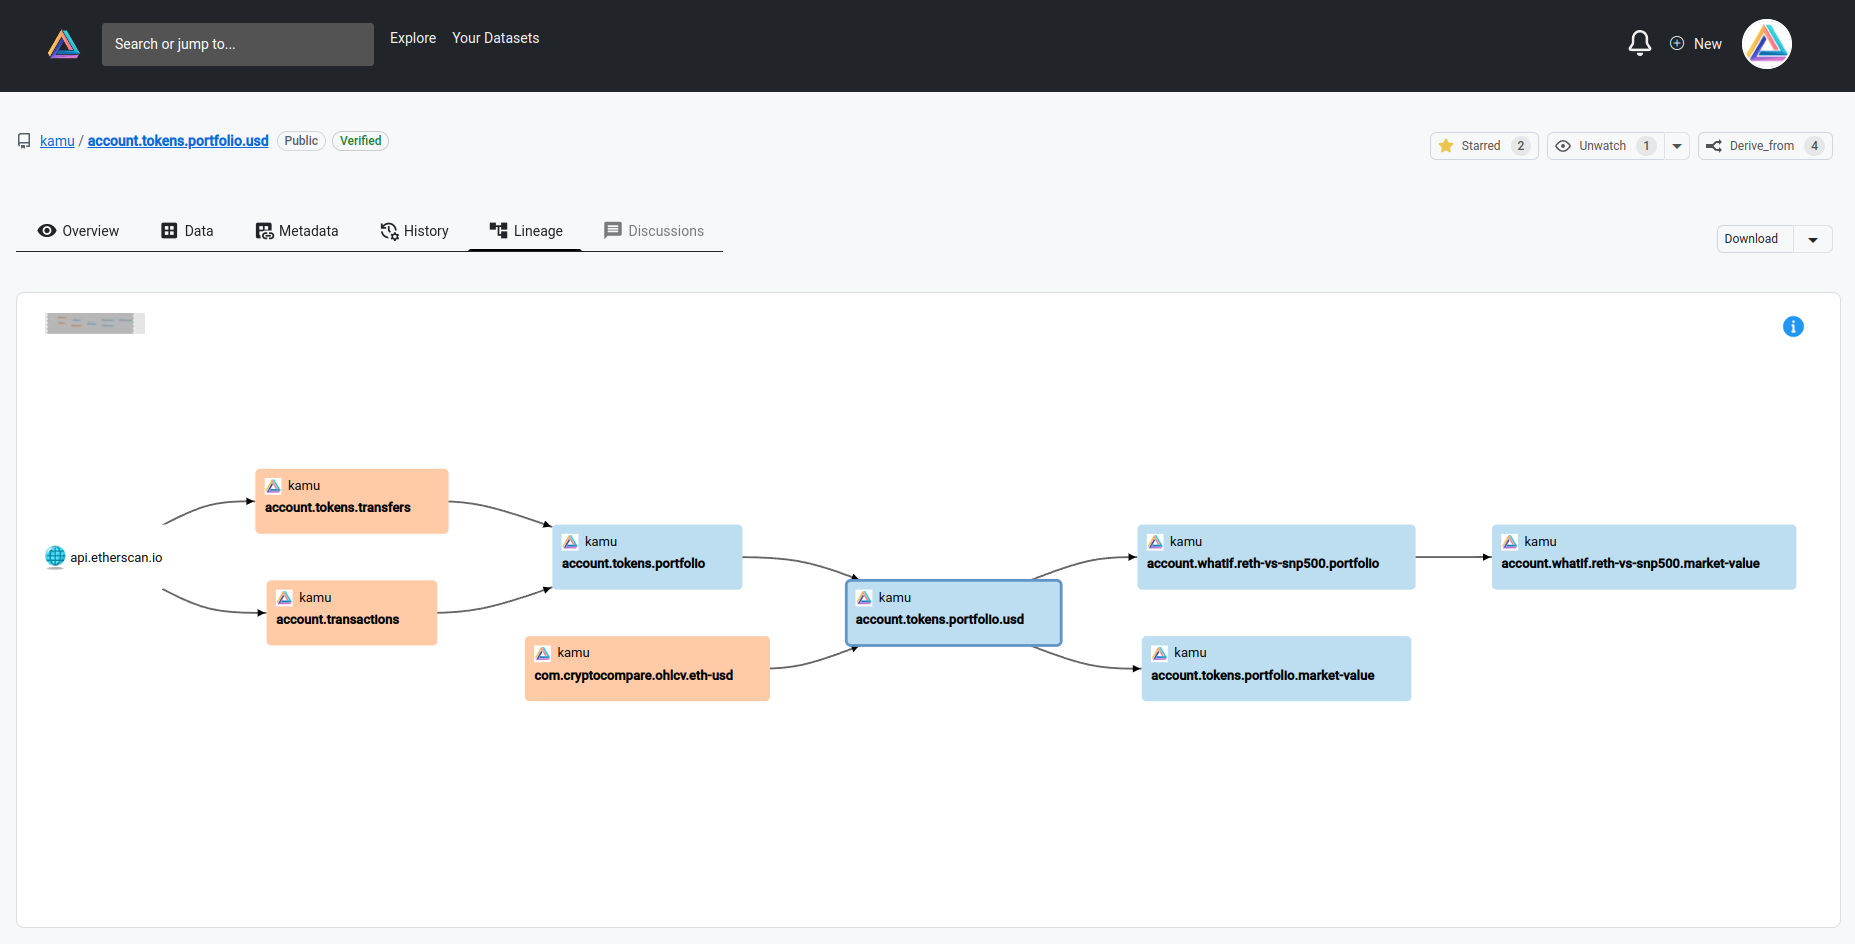
You can launch it by running:
kamu ui